Debugging ASP.NET and using Integrated Windows Authentication
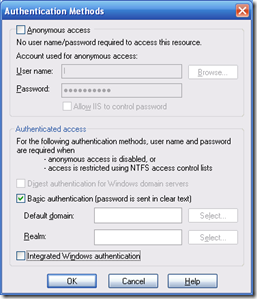
Last post I was looking at using integrated windows authentication in IIS. When I am working on a web site like this on my dev machine I often turn integrated windows authentication off and Basic Authentication on. This enables me to access the web site using different credentials that I can just type into the browser.
Please note that I only do this on my dev machine and would not recommend doing this in any public / production environment.
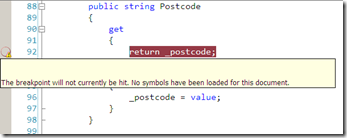
However there can be problems with the Visual Studio debugger. I noticed that sometimes I would try to set breakpoints but they would not be hit in the debugger. When I set breakpoints there was obviously something wrong as they appeared like this
And if I hovered over the yellow triangle with the mouse pointer then the tooltip appeared showing “The breakpoint will not currently be hit. No symbols have been loaded for this document” like this
This puzzled me, the symbols should be available, I check all the obvious stuff like was I trying to debug a release build (yes I have done that in the past and its very frustrating) but there was nothing obviously wrong. I checked out the VS debugger FAQ but none of the reasons it gave seemed to apply.
I did eventually find out what the problem was by spotting the pattern in what I was changing. The triangle appeared when I turned anonymous access off on the web site and forced authentication. If I checked integrated windows authentication then the breakpoints appeared normally and worked
I *think* what is happening is that VS debugger cannot authenticate against the w3wp worker process, I can use basic authentication in a browser, as it gives me a dialog to enter my credentials however VS does not ask for credentials. I can even attach the browser using basic authentication credentials and then turn on integrated windows authentication and then attach the debugger and it will work.


