Fitbit OS memory management
I have had my Timestyle for Fitbit watchface in the store now for five months and it seems to be going quite well.
However I have noticed that there appeared to be an intermittent issue and one of my users has been very helpful in trying to track the problem down. When I attached the device to the developer console I would sometimes see and error like this (though not always)
Fatal Jerryscript Error: ERR_OUT_OF_MEMORY
It seems to have been a problem with memory load, I wasn’t aware that clockfaces are limited to 64 KB, that includes code, data and assets so memory is pretty tight.
As with all intermittent memory issues they are not easy to track but having been through the process I have learnt a lot.
Measuring
First task was to be able to measure the amount of memory I was consuming using the Fitbit memory API. Its pretty straightforward to measure the amount of memory in use like this
1
2
3
4
5
6
7
8
9
10
11
12
13
14
15
16
17
18
19
20
import { memory } from "system";
import * as logging from "../common/logging";
import * as analytics from "./analytics"

const JS_MEMORY_ALERT_LEVEL = 60000;

export function logMemoryStats(message) {
  logging.info(`MEMORY: ${message} JS: ${memory.js.used} / ${memory.js.total}, Native: ${memory.native.used} / ${memory.native.total}`);
  if (memory.js.used > literals.JS_MEMORY_ALERT_LEVEL) {
    analytics.sendAnalyticsEventAndLabel(literals.ANALYTICS_CATEGORY_ERROR, literals.ANALYTICS_ACTION_MEMORY, memory.js.used);
  }
}

export function getJsMemoryUsed() {
  if (memory.js.used > literals.JS_MEMORY_ALERT_LEVEL) {
    logging.info(`JS Memory: ${memory.js.used}`);
    analytics.sendAnalyticsEventAndLabel(literals.ANALYTICS_CATEGORY_ERROR, literals.ANALYTICS_ACTION_MEMORY, memory.js.used);
  }
  return memory.js.used;
}
I can then see in the console how the memory is being consumed like this, and as a bonus I also send analytics
[11:07:17 AM] App: MEMORY: init JS: 55312 / 65528, Native: 333268 / 1168008
Its worth noting that the javascript memory seems to report pretty consistently between the device and the emulator, however native memory numbers are not available in the emulator.
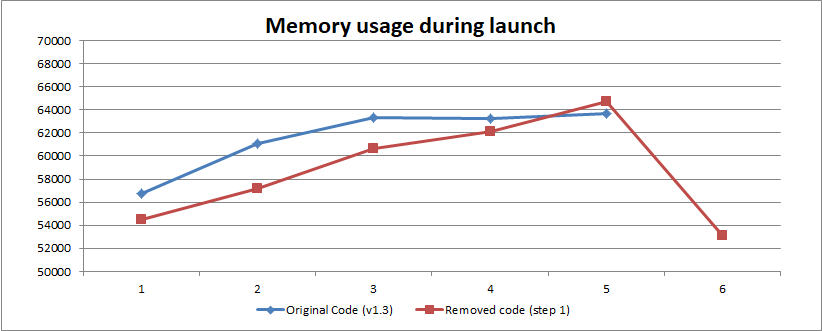
I measured the memory used at five different places during the clockface start up and then took one more reading when it was running.
Results
I recompiled the v1.3 code that I had released with the new SDK and added the memory logging. That pretty much pushed it over the edge and the clockface would no longer start as it ran out of memory when it was started, which is why I don’t have a figure for the running amount of memory used.
I wanted to see the memory profile for all steps until the clockface is running, so as Step 1 I removed code until I could get the app to run. This was a bit artificial as I had remove a large amount of functionality but it did give me the profile I was looking for. As you can see there looked to be about 10K of memory freed up when the app reached a stable state.
Options
The error occurs because the Fitbit javascript engine is running out of memory, Fitbit devices use the JerryScript embedded javascript runtime for constrained devices, there are some very good optimisation guidelines for the runtime as well as more specific guides on how to address memory. Now I could at least get the clockface to load I could start to experiment to see what my options were.
Interestingly when I tried one of the suggestions of eliminating global variables in favour of local variables calculated when they are needed the results were not impressive, if anything the memory footprint was worse, probably because I ended up with more functions. This underlined the importance of measuring each change and keeping records of each option.
Reorder launch sequence, step 2
I had a clue from the cut down app, step 1, when I saw that memory appeared to be being used by my clockface as well as the OS to launch the clockface. I cannot do anything about the OS launch footprint but I could delay my memory load until after the app was launched like this.
The original launch code looked a but like this, I have made it simpler for clarity
1
2
3
4
5
6
7
8
9
10
11
12
13
14
15
16
17
18
19
20
21
22
23
24
25
26
27
28
29
30
31
32
33
34
35
36
37
38
39
40
41
42
43
44
45
46
47
48
49
50
51
52
53
54
55
56
57
58
59
60
61
62
63
/* --------- CLOCK ---------- */
function clockCallback(data) {
  // main time display
  txt10Hours.text = data.hours10;
  txtHours.text = data.hours;
  txt10Mins.text = data.mins10;
  txtMins.text = data.mins;
  dayText.text = data.day;
  dateText.text = data.dayNumber;
  if (deviceSettings.isShowAmPm()) {
    txtAmPm.text = data.ampm;
  } else {
    txtAmPm.text = "";
  }
  handleOverrideIndicator(deviceSettings.isDeviceSettingsBeingUsed());
  realignDigits();

  // side panel
  var level = Math.floor(battery.chargeLevel);
  txtBattery.text = level + "%";
  batteryLevel.width = level / 2;
  updateBluetoothStatus(phone.is_phone_attached());

  // settings screen - the only place we show the real time
  var now = new Date();
  settingsTitleRight.text = `${now.getHours()}:${util.zeroPad(now.getMinutes())}`;
}

simpleClock.initialize(
  "minutes",
  "longDate",
  deviceSettings.timeFormat(),
  deviceSettings.isZeroPadMonth(),
  deviceSettings.isZeroPadHour(),
  deviceSettings.selectedIntervalAlert(),
  deviceSettings.selectedIntervalAlertStart(),
  deviceSettings.selectedIntervalAlertEnd(),
  deviceSettings.isOverrideTime(),
  deviceSettings.getOverrideMins(),
  clockCallback
);

/* ------- ACTIVITY --------- */
function activityCallback(data) {
  txtSteps.text = data.steps.prettyShort;
  switch (deviceSettings.selectedBottomDisplay()) {
    case literals.SETTING_PANEL_BOTTOM_DISPLAY_HEART_RATE:
      txtSecondary.text = data.heartRate.prettyShort;
      break;
    case literals.SETTING_PANEL_BOTTOM_DISPLAY_DISTANCE:
      txtSecondary.text = data.distance.prettyShort;
      break;
    case literals.SETTING_PANEL_BOTTOM_DISPLAY_FLOORS:
      txtSecondary.text = data.elevationGain.prettyShort;
      break;
  }
}
simpleActivity.initialize(
  "minutes",
  activityCallback,
  parseInt(deviceSettings.selectedBottomDisplay())==literals.SETTING_PANEL_BOTTOM_DISPLAY_HEART_RATE
);
console.log(`timestyle-fitbit v${literals.APP_VERSION} started, built ${buildTimestamp} , ${me.buildId}, ${me.launchArguments}`);
This just shows the clock and the activity monitor but the other parts of the app follow the same pattern: they initialise the object and trigger the callback function while the application was being started by the OK.
I changed the code to be like this
1
2
3
4
5
6
7
8
9
10
11
12
13
14
15
16
17
18
19
20
21
22
23
24
25
26
27
28
29
30
31
32
33
34
35
36
37
38
39
40
41
42
43
44
45
46
47
48
49
50
51
52
53
54
55
56
57
58
59
60
61
62
63
64
65
66
67
68
/* --------- CLOCK ---------- */
function clockCallback(data) {
  // main time display
  txt10Hours.text = data.hours10;
  txtHours.text = data.hours;
  txt10Mins.text = data.mins10;
  txtMins.text = data.mins;
  dayText.text = data.day;
  dateText.text = data.dayNumber;
  if (deviceSettings.isShowAmPm()) {
    txtAmPm.text = data.ampm;
  } else {
    txtAmPm.text = "";
  }
  handleOverrideIndicator(deviceSettings.isDeviceSettingsBeingUsed());
  realignDigits();

  // side panel
  var level = Math.floor(battery.chargeLevel);
  txtBattery.text = level + "%";
  batteryLevel.width = level / 2;
  updateBluetoothStatus(phone.is_phone_attached());

  // settings screen - the only place we show the real time
  var now = new Date();
  settingsTitleRight.text = `${now.getHours()}:${util.zeroPad(now.getMinutes())}`;
}

/* ------- ACTIVITY --------- */
function activityCallback(data) {
  txtSteps.text = data.steps.prettyShort;
  switch (deviceSettings.selectedBottomDisplay()) {
    case literals.SETTING_PANEL_BOTTOM_DISPLAY_HEART_RATE:
      txtSecondary.text = data.heartRate.prettyShort;
      break;
    case literals.SETTING_PANEL_BOTTOM_DISPLAY_DISTANCE:
      txtSecondary.text = data.distance.prettyShort;
      break;
    case literals.SETTING_PANEL_BOTTOM_DISPLAY_FLOORS:
      txtSecondary.text = data.elevationGain.prettyShort;
      break;
  }
}

function initClockface() {
  simpleClock.initialize(
    "minutes",
    "longDate",
    deviceSettings.timeFormat(),
    deviceSettings.isZeroPadMonth(),
    deviceSettings.isZeroPadHour(),
    deviceSettings.selectedIntervalAlert(),
    deviceSettings.selectedIntervalAlertStart(),
    deviceSettings.selectedIntervalAlertEnd(),
    deviceSettings.isOverrideTime(),
    deviceSettings.getOverrideMins(),
    clockCallback);

  simpleActivity.initialize(
    "minutes",
    activityCallback,
    parseInt(deviceSettings.selectedBottomDisplay())==literals.SETTING_PANEL_BOTTOM_DISPLAY_HEART_RATE
  );
}

// delay the init until the app is launched
setTimeout(function() { initClockface(); }, 1);
console.log(`timestyle-fitbit v${literals.APP_VERSION} started, ${me.buildId}, ${me.launchArguments}`);
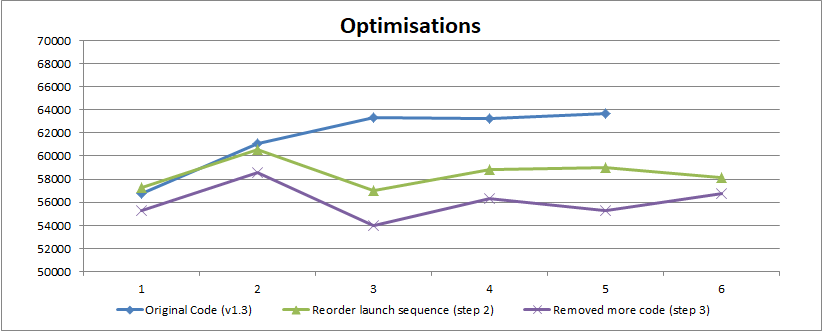
The setTimeout() call means that all my object initialisation and callback triggering will happen after the app has completely launched, one second after to be specific. This is step 2 on the graph and as you can see I have not reduced the memory being used but I have changed when that memory is used so that the memory profile is much more smooth.
Removed unneeded code, step 3
The next step was to go through the application and look for code that was not being used, or that was only used to make debugging it easier, when I removed all that code not only was the profile smother but also at its peak load over a two week trial it never got nearer than 4KB from the end of memory, its still pretty close but hopefully it will be enough to fix the black screen issues some of my users reported.
It is open source so you can see the results in full.

